Note
Go to the end to download the full example code
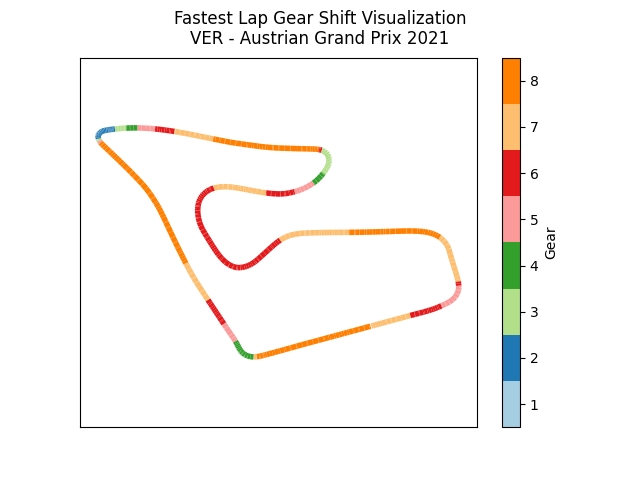
Gear shifts on track#
Plot which gear is being used at which point of the track
Import FastF1 and load the data
import matplotlib.pyplot as plt
import numpy as np
from matplotlib import colormaps
from matplotlib.collections import LineCollection

import fastf1


session = fastf1.get_session(2021, 'Austrian Grand Prix', 'Q')
session.load()

lap = session.laps.pick_fastest()
tel = lap.get_telemetry()
Prepare the data for plotting by converting it to the appropriate numpy data types
x = np.array(tel['X'].values)
y = np.array(tel['Y'].values)

points = np.array([x, y]).T.reshape(-1, 1, 2)
segments = np.concatenate([points[:-1], points[1:]], axis=1)
gear = tel['nGear'].to_numpy().astype(float)
Create a line collection. Set a segmented colormap and normalize the plot to full integer values of the colormap
cmap = colormaps['Paired']
lc_comp = LineCollection(segments, norm=plt.Normalize(1, cmap.N+1), cmap=cmap)
lc_comp.set_array(gear)
lc_comp.set_linewidth(4)
Create the plot
plt.gca().add_collection(lc_comp)
plt.axis('equal')
plt.tick_params(labelleft=False, left=False, labelbottom=False, bottom=False)

title = plt.suptitle(
    f"Fastest Lap Gear Shift Visualization\n"
    f"{lap['Driver']} - {session.event['EventName']} {session.event.year}"
)
Add a colorbar to the plot. Shift the colorbar ticks by +0.5 so that they are centered for each color segment.
cbar = plt.colorbar(mappable=lc_comp, label="Gear",
                    boundaries=np.arange(1, 10))
cbar.set_ticks(np.arange(1.5, 9.5))
cbar.set_ticklabels(np.arange(1, 9))


plt.show()
Total running time of the script: (0 minutes 2.802 seconds)